US Economic Surprise Index: Key Insights and Market Impact
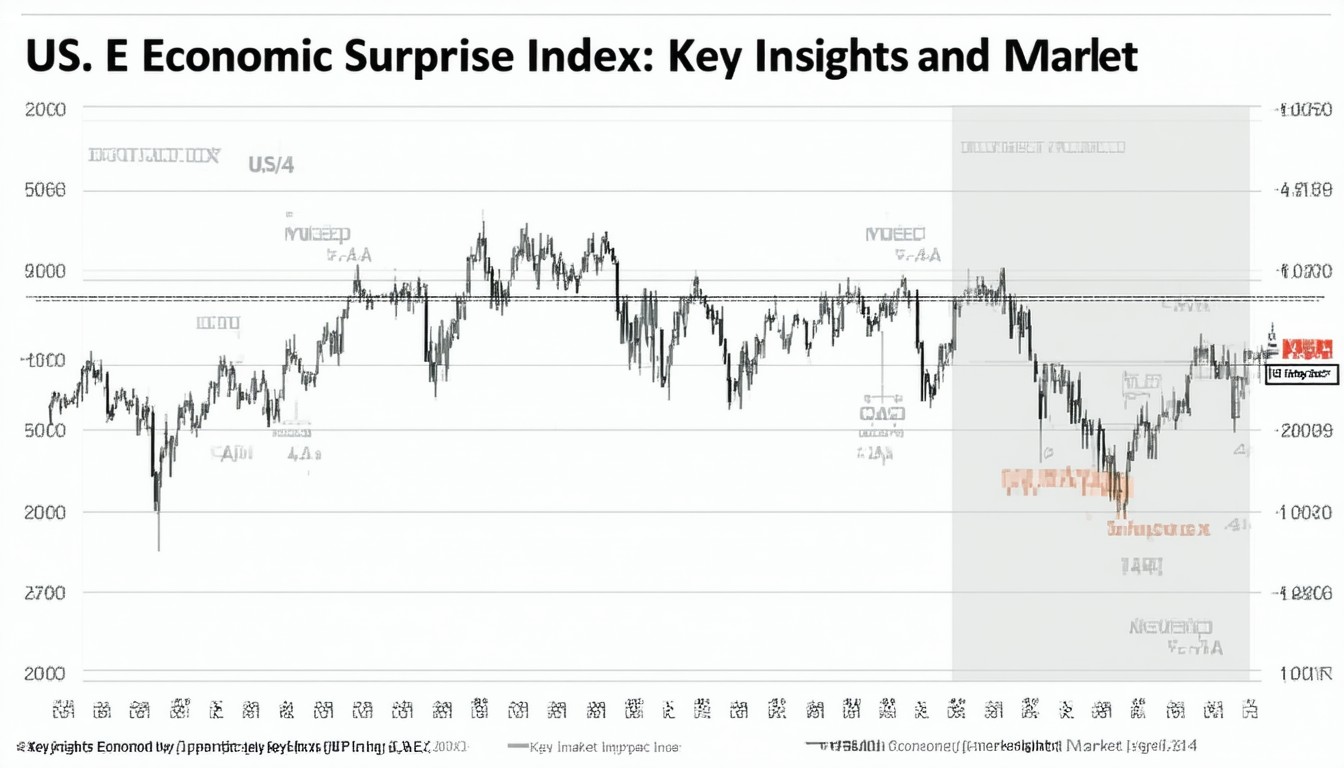
The financial world is driven as much by expectations as by reality. Nowhere is this dynamic clearer than in the response of markets to economic data releases. The US Economic Surprise Index (ESI) captures this interplay, offering a unique lens through which investors and policymakers assess the gap between forecasts and outcomes. Recognized as a barometer of economic momentum, the ESI has become increasingly influential—guiding market sentiment, shaping asset allocation, and fueling debates across trading floors.
What Is the US Economic Surprise Index?
At its core, the US Economic Surprise Index measures whether recent US economic data has tended to beat, match, or fall short of consensus forecasts. This index, originally developed by Citigroup, aggregates dozens of key indicators—such as job numbers, consumer spending, and GDP growth—and compares each outcome against economists’ predictions.
When a flurry of strong economic releases outpaces expectations, the index rises. Conversely, disappointments cause it to fall. Notably, the absolute values matter less than the direction of movement, reflecting shifts in market narratives rather than the level of economic activity itself.
How the Index Is Calculated
- Selection: The ESI draws from a basket of diverse, high-impact reports released throughout the month.
- Scoring: Each economic release is assigned a score based on how much it diverges from consensus forecasts.
- Aggregation: Scores are averaged using a rolling window, creating a composite measure that smooths out volatility from any single data point.
By quantifying these surprises, the ESI becomes a dynamic gauge of market sentiment.
Why the ESI Matters: Real-World Market Impact
Financial markets are forward-looking and highly reactive to surprises—both positive and negative. When data beats estimates, investors may interpret this as momentum for growth, boosting risk assets like equities or strengthening the US dollar. The opposite holds true when data disappoints.
“The Economic Surprise Index acts as a sentiment barometer for the market. It’s less about the absolute economic numbers and more about whether those numbers are living up to—or confounding—expectations.”
— Liz Ann Sonders, Chief Investment Strategist, Charles Schwab
Case Studies: ESI in Action
Consider the sharp rally in US stocks during periods when the ESI has surged into positive territory. For instance, during the post-pandemic recovery in 2020, a series of upside surprises in employment and retail sales reports sent the ESI to record highs. This aligned with a rebound in equity markets, as investors re-rated their growth expectations.
Conversely, negative ESI readings have occasionally preceded corrections or heightened volatility. When in early 2022 multiple releases underwhelmed forecasts—amid concerns about inflation and supply chains—the ESI retreated, and markets responded with renewed caution.
Asset Class Responses
- Equities: Positive surprises tend to favor cyclicals and growth-oriented sectors.
- Currency Markets: The US dollar often strengthens on better-than-expected data, reflecting relative optimism regarding the US economy.
- Interest Rates: Bonds typically weaken as positive surprises revive concerns about faster rate hikes by the Federal Reserve.
Interpreting the US Economic Surprise Index: Cautions and Nuance
While the ESI is a powerful tool, it comes with caveats. Markets are adept at “pricing in” expectations, and sharp moves in the index can sometimes reflect overexuberance or despair rather than sustainable economic shifts. Moreover, the predictive value of the ESI is inherently cyclical—what surprises positively one quarter may come to be widely anticipated, reducing the index’s signaling power.
Common Misconceptions
- Not a Direct Predictor of Growth: A high ESI does not guarantee robust GDP expansion; it only shows that data is beating expectations.
- Short-Term Signal: The ESI is often best used as a short-term sentiment gauge, rather than a long-range predictor.
Expert Perspective
In practice, sophisticated investors use the ESI as one piece of a broader mosaic. It complements traditional macro analysis, technical indicators, and company fundamentals.
Integrating the ESI into Investment Strategies
The ESI’s greatest utility arguably lies in tactical asset allocation and risk management. Portfolio managers watch ESI swings to fine-tune exposures—adding to positions during periods of positive surprise momentum or leaning defensively when negative surprises mount.
Application in Trend-Following and Macro Funds
Many systematic funds incorporate the ESI (and global counterparts) in their models. For example, a sudden turn from negative to positive readings may trigger a reallocation into equities or high-yield debt, guided by an expectation that risk appetite will rise.
Communication with Clients and Stakeholders
Advisors often reference the ESI when explaining sudden market moves. It provides a context-rich way to discuss why assets might react strongly even when reported numbers seem “good” or “bad” in an absolute sense—underscoring the centrality of expectations in market psychology.
The US ESI in Global Context
While this discussion focuses on the US, similar surprise indexes exist for other major economies, including the Eurozone, UK, and emerging markets. Comparing the US ESI with those of other countries can illuminate cross-market trends, highlight relative strength, or reveal where expectations are most vulnerable to disruption.
Example: Divergence Across Regions
Periods when the US ESI outpaces Europe’s can be characterized by global capital flows favoring US assets, as seen during much of the Fed’s tightening cycle in 2022. Conversely, a sharp turn in international surprises may prompt a reconsideration of global allocations.
Key Takeaways and Strategic Recommendations
The US Economic Surprise Index remains a vital gauge for understanding both market psychology and the economic narrative. While its readings do not forecast the future directly, they offer critical insight into the alignment—or misalignment—between expectations and reality.
- Use the ESI as a sentiment gauge, not a sole predictor.
- Watch for inflection points: sudden turns often precede shifts in market trends.
- Combine ESI insights with broader fundamental and technical analysis for best results.
For investors and analysts, staying attuned to the ESI can sharpen risk awareness and inform tactical decisions. The real advantage lies not just in tracking surprises, but in anticipating how a shift in expectations will ripple through global markets.
FAQs
What does a positive US Economic Surprise Index mean?
A positive ESI indicates that recent US economic data releases have, on average, exceeded analysts’ expectations. This often provides a tailwind for riskier assets and can lead to stronger performance for the US dollar.
How frequently is the US Economic Surprise Index updated?
The ESI is typically updated in real-time or daily by financial institutions, reflecting the latest available data releases compared to consensus forecasts.
Is the Economic Surprise Index predictive of future market returns?
While the ESI is a useful sentiment gauge, it does not directly predict long-term market returns. Its greatest value lies in highlighting short-term shifts in sentiment that may influence asset prices.
Can individual investors use the ESI?
Yes, many professional and retail investors monitor the ESI to better understand market sentiment and potential volatility. However, it should be used alongside other analysis tools for a more complete picture.
Are there global versions of the Economic Surprise Index?
Yes, similar surprise indexes are published for other countries and regions, such as Europe, Asia, and emerging markets. These allow for cross-market comparison and can illustrate divergent economic trends around the world.